Topic Richness Across Both Phases
This data visualization depicts the topic richness between the first phase of MC3: Meeting the Climate Change Challenge case study interviews and the second phase, when we re-interviewed a sub-sample from the original interviewees. This data is compiled from the two sets of interview transcripts, although the City of Vancouver is not yet included, as we were missing nine interview transcripts that are now being analyzed.
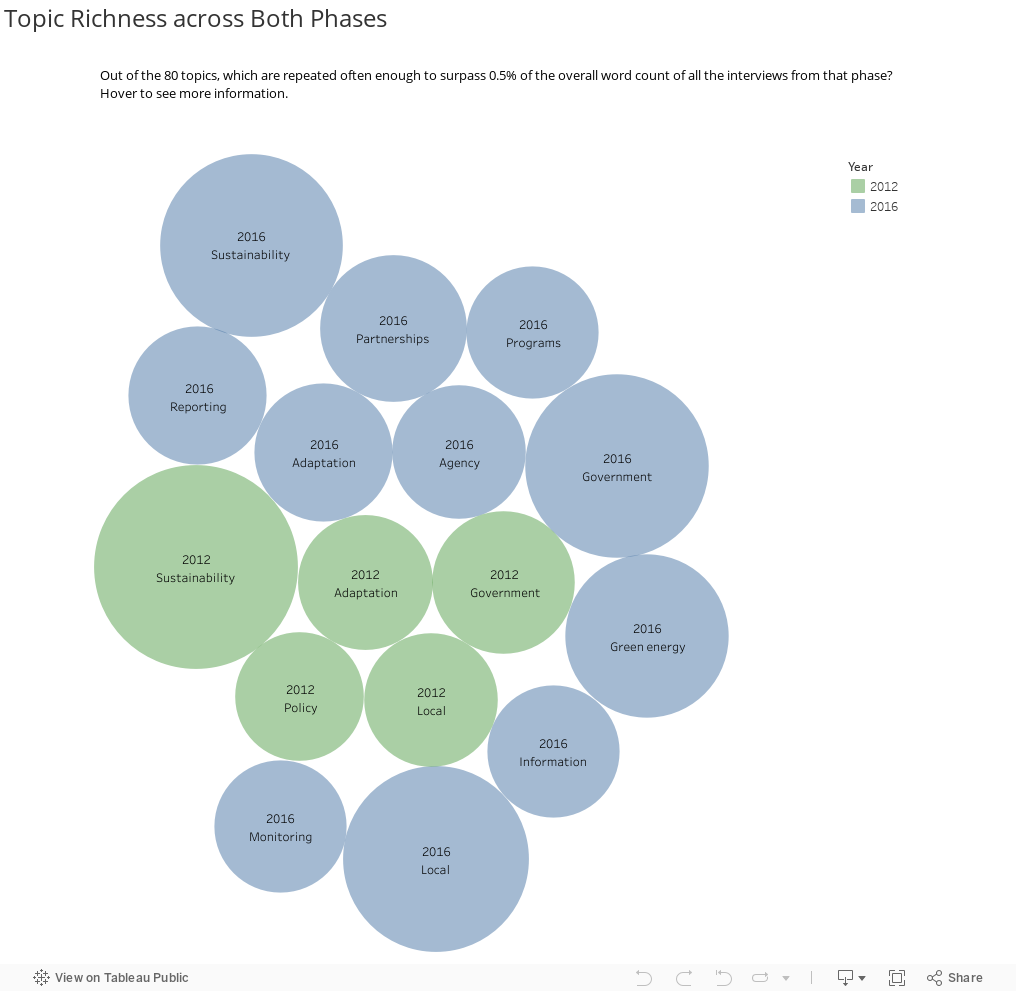
The same minimum was applied to both years: out of the 80 topics, which are repeated often enough to make up 0.5% or more of the overall word count of all the interviews from that phase? In 2012, only five topics made it past this threshold. In 2016, eleven topics are above the 0.5% threshold. This means that comparatively, 2012 has a significantly lower topic richness than 2016. More than twice as many topics are represented in the top percentile in 2016 than in 2012. From this data, it seems that communities in 2016 are talking about sustainability in more detail (i.e. more richly, using more varied vocabulary) than they were in 2012.