Top Topics Overall
In the visualization below, the top topics across both years are represented, and where they overlap we see a bi-coloured wheel. What is really interesting about this visualization is the representation of topics that still top the list despite being only in one or the other year. Green energy topped the list in 2016 but not in 2012, meaning that it was referenced much more in the later phase of interviews.
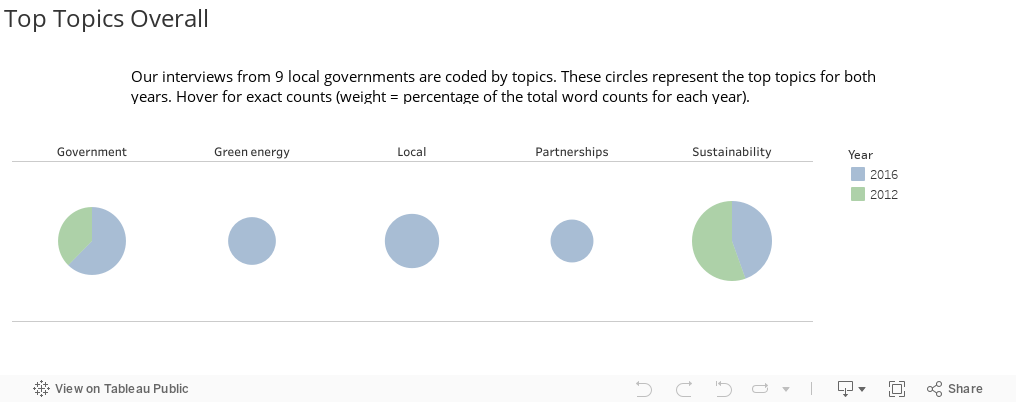
Notes: topics are in alphabetical order; this visualization represents 9 local governments rather than 11, since Vancouver and Eagle Island are not yet included as we continually update our data.
To read more about this methodology of "text mining", see our recent write-up here.


